CORONA VIRUS AT COLOMBIA AND THE WORLD 2022

Get the data
First off I went to ourworlindata.org the get the latest data from coronavirus 19, then I checked in excel, and with power query, I extracted the data required and put it in two files to make the queries more dynamic, start working with SQL server management and uploaded the files
Data that I'll use
I start the exploratory queries to find what type of data I have
SELECT location, date, total_deaths, new_cases, population, total_cases
FROM portafolioprojectcovid..covidD
ORDER BY 1,2
SELECT location, New_Vaccinations, total_vaccinations
FROM portafolioprojectcovid..covidV
ORDER BY 1,2
Analysis in Colombia
This query is to find the percentage of the population that has been infected
SELECT  location,CAST( date AS Date) as date,population, total_cases ,(total_cases/population)*100 as Cases_pertcentageFROM portafolioprojectcovid..covidD
WHERE location = 'Colombia'and  date ='2022-10-17 00:00:00.000'
ORDER BY   2 DESC
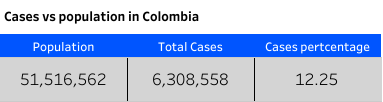
I find that around 12% of the population of Colombia has been infected
This querie is to find the percentage of the population that had died
SELECT  location, CAST( date AS Date) as date, total_deaths,  total_cases ,population,(total_deaths/total_cases)*100 as DeathpercentageFROM portafolioprojectcovid..covidD
WHERE location = 'Colombia'and  date ='2022-10-17 00:00:00.000'
ORDER BY  2 DESC
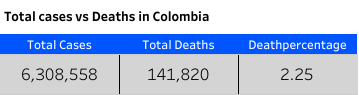
I find that around 2% of the population of Colombia had died
- This querie is to find the percentage of vaccines given compared with the population of Colombia
With PopvsVac (Continent, Location, Date, Population, New_Vaccinations, RollingPeopleVaccinated)as(Select dea.continent, dea.location, dea.date, dea.population, vac.new_vaccinations, SUM(CONVERT(FLOAT,vac.new_vaccinations)) OVER (Partition by dea.Location Order by dea.location, dea.Date) as RollingPeopleVaccinated--, (RollingPeopleVaccinated/population)*100
From portafolioprojectcovid..covidD dea
Join portafolioprojectcovid..covidV vac    On dea.location = vac.location    and dea.date = vac.date
where dea.continent is not null
and dea.location = 'Colombia')

Select *, (RollingPeopleVaccinated/Population)*100 as PercentPeopleVaccinated, CAST( date AS Date) as dateFrom PopvsVacwhere date ='2022-10-17 00:00:00.000'
order by 3 desc
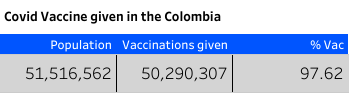
I find that the vaccines given compared with the population of Colombia is around 97%
Analysis in the World
- This querie is to find the percentage of people that had died in the world
Select SUM(new_cases) as total_cases, SUM(cast(new_deaths as bigint)) as total_deaths, SUM(cast(new_deaths as bigint))/SUM(New_Cases)*100 as DeathPercentage
From portafolioprojectcovid..covidD
where continent is not null
and location not in ('World', 'European Union', 'International', 'High income', 'Low income', 'Lower middle income', 'Upper middle income')
order by 1,2
.png)
I find that around 1% of the population had died in the world
- This query is to find the number of people that had died in the world per continent
Select continent, SUM(cast(Total_deaths as bigint)) as TotalDeathCount
From portafolioprojectcovid..covidDWhere continent is not null
Group by continent
order by TotalDeathCount desc
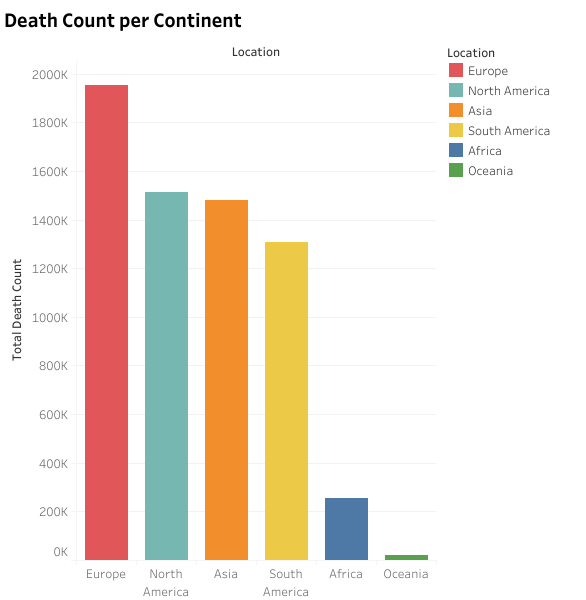
I find that America is the continent that has more deaths, followed by Europe and Asia
- This query is for looking at a map of the highest infection rate
Select location, Population, MAX(total_cases) as HighestInfectionCount,  Max((total_cases/population))*100 as PercentPopulationInfected
From portafolioprojectcovid..covidD
Group by Location, Population
order by PercentPopulationInfected desc
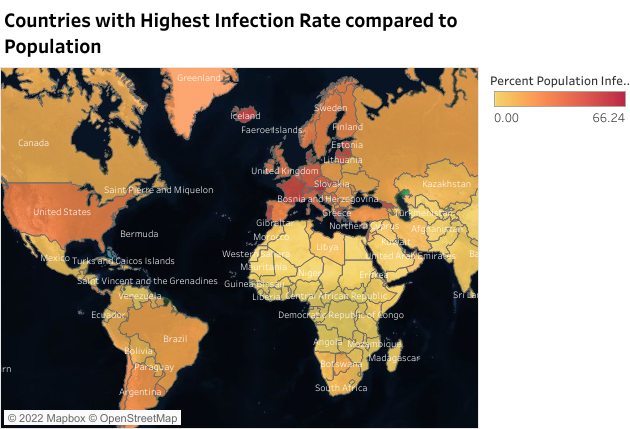
I find that Europe is the continent that has more Infection rate among the others
- This query is for looking at a graph of the infection rate percentage compared with the population of some relevant countries and some forecasting of those
Select location, date, Population, MAX(total_cases) as HighestInfectionCount,  Max((total_cases/population))*100 as PercentPopulationInfected
From portafolioprojectcovid..covidD
Group by Location, Population
order by PercentPopulationInfected desc
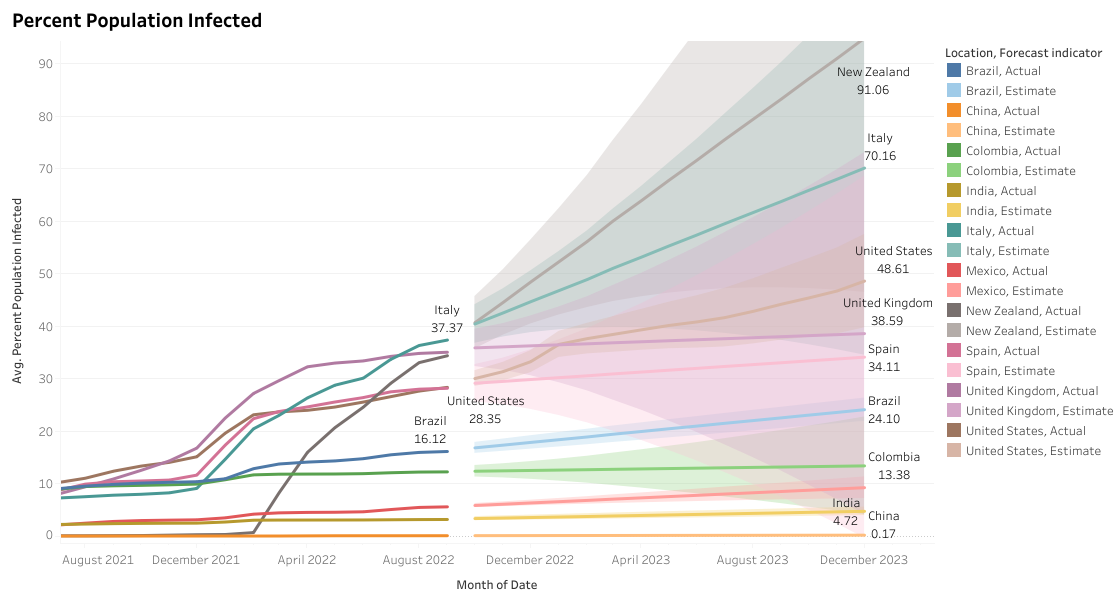 Among these countries, Italy has the 37% of its population infected, followed closely by the united kingdom and New Zeland with around 35% of its population that had been infected
- This query is to understanding how many vaccines have been given to the population of the world per continent
Select  d.location, d.date, d.population
, MAX(v.total_vaccinations) as RollingPeopleVaccinatedFrom
portafolioprojectcovid..covidD d
Join portafolioprojectcovid..covidV v
On d.location = v.location    and d.date = v.date
where  d.date ='2022-10-17 00:00:00.000'and d.location  in ( 'Africa', 'Asia', 'Europe', 'North America', 'Oceania', 'South America','World')
group by d.continent, d.location, d.date, d.population
order by 1,2,3 DESC
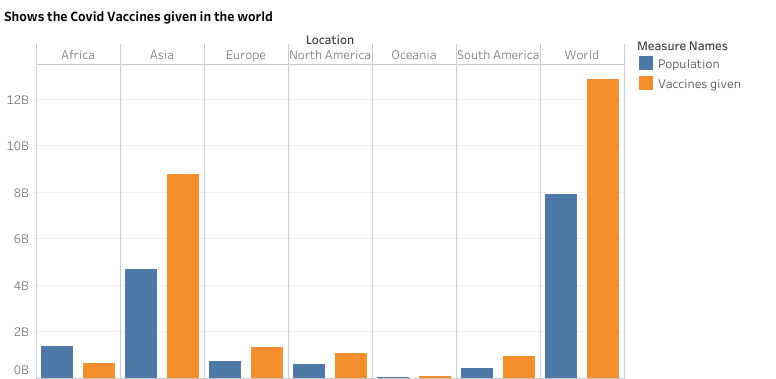
This shows that almost in every continent the vaccines given have surpassed their population, but understanding that normally every person took around two or three, it should be seen with caution this graph
Conclusion
Colombia is expected to maintain the cases of people infected around 12% or lower, which is great news since is my native country, this could be for the cultural acceptance of the vaccine and the implemented protocols to prevent this disease
Even though this disease took all over the world, the death percentage is really low being 1%, this could be for the fact of the rapid creation of the vaccine and its spread around the globe
Around the world, the vaccines that have been given are almost double, but this should be even more since some predictions are that the cases are still going to growth